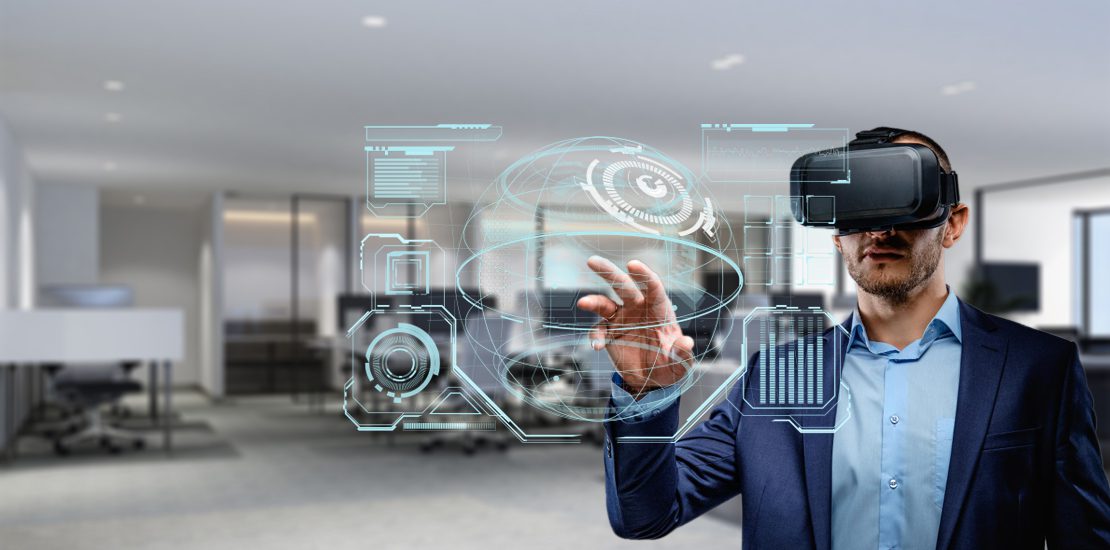
While bar graphs, line graphs, and pie charts were used to be the go-to tools to visualize data, they are inadequate to illustrate the complexity of the data we collect today. According to Forbes statistics, 2.5 quintillion bytes of data is created every day; over the last two years, the world’s 90% of data was created. Insights need to be extracted from this huge amount of data efficiently and precisely to perceive them as facts for informed decision-making and maximize customer engagement levels, efficiency, and business capabilities. AR VR technology can transform data analytics in an organization turning visualization for better understanding and pattern recognition.
With AR and VR presentations, you can deliver a winning communication strategy in a simple 3D and interactive experience. Data is the core of digital transformation making unprecedented advances in machine learning, anthropology, science, geology, chemistry, physics, astronomy, and psychology, to name a few. Whether for sales, inventory analysis, financial projections, purchase orders, sales orders, scientific research, or product visualization meaningful insights accessible to everyone is obtained through AR VR data visualization. Let us explore some infinite possibilities of 3D data visualization, and how it can be used for impactful and data-driven decision-making.
1. Better and actionable data insights
The agility to react to changing situations is crucial for organizational success, which is achieved mainly through actionable data presented in a discernable format. The demand for AR VR development services, facilitating interactive data visualization, is on the rise, making it possible for executives with limited mathematical proficiency to grasp the intricacies of data.
Usually collecting, analyzing, and extracting useful insights from a huge amount of data consumes a lot of time and creates blurry and irrelevant conclusions. Data visualization plays a pivotal role here as it inspects and extracts only the actionable data with minimal effort. The use of AR VR in data visualization further enhances process effectiveness by rendering an immersive environment where you can ‘step inside your data’. For example, integrating VR technology in the product development lifecycle can precisely detect flaws and mistakes early that may further lead to production delays or other business challenges.
2. AR VR in data visualization with fewer distractions
AR VR data visualization transforms plain and boring numbers into catchy stories to better understand data. Users can directly interact with the big data that surrounds them and explore it with their eyes and hands, instead of a keyboard and mouse. The interaction through virtual reality is more natural as you can press buttons, zoom graphs, move windows and arrange data streams. VR-enabled applications provide a better user experience to interact with data and make data visualization more effective. Integrating AR with AR glasses or contact lenses can reduce device intrusion and provide a hand-free interaction experience.
Visualizing data structures in VR and AR helps you better concentrate on the objective, as you have your entire field of vision in it. This gives a true feel of scale and a holistic vantage as you are immersed in the data that’s impossible with traditional ways of data visualization.
3. Multidimensional AR VR data analysis
The human brain is wired to process information quickly when it’s presented in multiple dimensions. Our natural instinct to process information and analyze data in multiple dimensions is imitated in AR VR-powered visual data structures. We mainly use our sight and hearing for a better understanding of data like the significance, content, and even location of a particular data through the loudness, or other sound parameters. The immersion of a user in the data representation using different senses would process the information more efficiently and smoothly. AR and VR technology allows users to ‘feel’ the data with the haptic feedback gloves to improve data visualization radically.
4. Enhancing decision-making capabilities
Data scientists can reap the benefits of gathering important facts and figures fastly from the analysis report with the help of AR VR in data visualization. This significantly enhances the decision-making process of organizations by building efficient strategies to attain critical business goals in the lowest timeframe. Implementing AR and VR solutions facilitates business processes through prompt responses that effectively run daily operations.
5. Collaboration in real-time
A collaborative form of immersive data visualization presents the data on the table and enables the users to hover over it, explore the details, and generate charts. Users can also add new datasets, charts, graphs, and variables, and understand the data completely through immersive technologies. The visualizations can also act as a virtual meeting room where the entire team can collaborate and work on the data projections. For example, Virtualitics, one of the tech leaders in this space offers 3D data sets that multiple users can experience and manipulate at the same time.
6. Improved data research and presentations
3D data visualizations using AR and VR are highly useful for elevating the data research process during various stages. Nowadays, data scientists are massively using these techniques to unveil complicated data structures and extract hidden patterns. VR simulations not only emphasize the data exploration process but can also predict future business trends for long-term planning through 3D data models. Besides, AR VR technologies provide an effective way to collaborate within the organization and share discoveries with the stakeholders in a most appealing and presentable manner.
Immersive Data Analytics Platforms
Bader, the world’s first immersive data analytics platform, makes real-time collaboration possible allowing users to extract valuable insights from data without any special training. Virtualitics is another innovator with an AI-driven visualization VR tool that helps companies get actionable insights faster and allows multiple users to manipulate 3D data sets at the same time. DataView VR provides a virtual workspace that can also be called the “Workplace of the Future” to power immersive data presentations. 3Data is a 3D virtual platform developed for IT and cybersecurity operations with the ability to interact with the command and manipulate complex networks for better and faster decisions.
Conclusion
Accurate data analysis is the key to today’s data-driven business ecosystem. AR and VR data visualization breaks down the complexity of the data and offers more natural interactions, greater space, multidimensionality, and fewer disruptions. Besides, it will enable business organizations to augment their growth curve through advanced data analytics and data-driven decision-making processes.
Are you ready to explore the infinite possibilities of AR VR in data visualization? Contact Travancore Analytics, a leading AR VR development company to assist you in your digital transformation journey.
Ready to turn your idea into a powerful digital solution?
Partner with our experts to design, build, and scale technology tailored to your business goals.
Contact us Today