Performance testing is a type of software testing that evaluates the responsiveness, speed, stability, and scalability of an application or system under a specific workload or user load. It aims to measure the performance of the application or system and determine whether it meets the desired performance criteria or not.
Performance testing involves simulating real-world scenarios and user activities to identify potential bottlenecks, system limitations, and other issues that can impact the application’s performance. The testing process may involve measuring the response time, throughput, resource utilization, and other performance metrics of the system under different types of loads, such as heavy traffic, peak loads, and stress loads.
Any application development process must include performance testing since it aids in identifying and resolving performance issues that could negatively impact the user experience. We’ll go over how to use SignalR Jmeter for performance testing in this blog.
Performance testing using SignalR JMeter involves evaluating the performance of real-time web applications built using SignalR technology. SignalR is a framework that enables real-time communication between the server and the client using web sockets or other transport protocols. JMeter is an open-source performance testing tool that is widely used for testing web applications. It can be used to simulate various types of loads, including heavy traffic, peak loads, and stress loads, to measure the performance of the application or system under test.
To perform performance testing using SignalR JMeter, testers need to create test plans and configure the JMeter to simulate user activity and network traffic. This involves setting up the test environment, creating test scenarios, defining metrics to measure, and setting up data points to monitor.
The test scenarios involve simulating real-world user activities, such as logging in, accessing different pages, and sending messages. The performance metrics include response time, throughput, resource utilization, and other performance indicators that help identify bottlenecks, system limitations, and other issues that can impact the application’s performance.
Testers can ensure that the real-time web application built using SignalR technology is performing optimally and meeting the performance requirements set by the business or end-users. This can help improve the user experience, increase customer satisfaction, and prevent potential revenue loss due to poor system performance.
Note: If you are looking for replicating transport types like Server Sent Events or Long Polling in SignalR,this blog does not discuss it and only deals with WebSockets transport type in SignalR.
In one of our recent projects, we have developed a web application for playing weekly real-time quiz online between a group of people. The number of people playing concurrently depends on the number of people signed up for the current week game. So it was needed to test the current architecture to find its limits. Our web app primarily uses Azure SignalR for real-time communication. The web app is written in .Net Core 2.0. Azure SignalR primarily uses the WebSocket protocol to establish a persistent connection between the client and the server. After lots of deliberation, we ended up selecting JMeter to record the HTTP traffic as well as the WebSocket traffic and then mimic clients by using a tool called Redline13.
STEP 1: Recording all Http Requests
The first step is to record the HTTP traffic inside your website. The process of recording HTTP traffic is pretty straight-forward as explained in this blog post.
In case you are not familiar with JMeter, have a look at this post.
STEP 2: Recording all WebSocket Communication
Once Step 1 is done, you have to record the WebSocket communication between the server and the client.
Unfortunately, there is no in-built support for capturing WebSocket traffic in Jmeter but third-party plugins are available for creating WebSocket connection, reading the incoming messages and sending a message to the server.
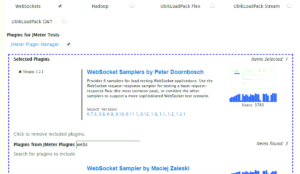
At the time of writing this blog, WebSocket Samplers by Peter Doornbosch is the most comprehensive of the lot and we used it.
To add a plugin to JMeter follow this blog post.
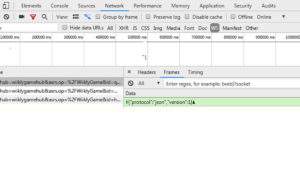
- To view the WebSocket traffic in your SignalR app inspect the browser and go into the network tab and click on the WS connection that is used by the web app.
In the sub-window that opened, click on the Frames tab and you can see the all the frames of data communication to and fro the server. Depending on the nature of your traffic through WebSocket use the various samplers provided in the plugin. - In SignalR, always the first frame to be sent from client is a HandshakeRequest
{“protocol”:”json”,”version”:1}
which can be sent using single write samper.
Note: All JSON messages must be terminated by the ASCII character 0x1E (record separator).
Without this character, the JMeter sampler won’t work properly since it denotes the end of the message. Thus, the server will continue to listen for the continuation of the message. This character is not visible in all text editors, but you could see it in the browser window as an opaque black triangle at the end of each frame.
STEP 3: Customizing JMeter Script According to User-behavior
Now that we have added all the network requests. According to the properties of your web app, you could use different JMeter features to exactly replicate user behavior on the website.
- For importing variables from a csv sheet, you could use the CSV Data Set Config.
- JMeter provides JMeter variables which can be used to have dynamic values in your requests.
- For any logical calculations we can write scripts in between requests with any of the scripting languages supported like JavaScript, groovy and jexl3.
- For processing response data, you could add processors like JSR223 samplers or JSR223 pre/post processors.
- For adding delays between two request invocations, you could use constant timers.
- For looping or conditional request, invocations check out these logic controllers.
- For extracting text from the response, you can use regex extractor.
- When using WebSocket samplers, the server occasionally sends ping messages to acknowledge the client, and which should be returned using pong messages.
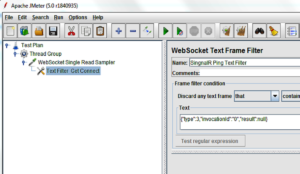
This can be done using WebSocket Ping/Pong Frame Filter. - In signalR applications, occasionally the signal ping messages are sent by the SignalR server which can interfere with your WebSocket Single Read Sampler.
So to filter out those incoming message frames you could use WebSocket Text Frame Filter.
SignalR Ping message: – {“type”:3,”invocationId”:”0″,”result”: null}
STEP 4: Increasing the Users and Testing in the Cloud
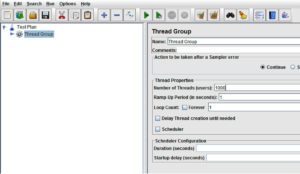
Now that we have completed the request flow for one user, it’s time to magnify the number of users by increasing the thread count in the JMeter script.
- The thread group has a property to specify thread count which denotes the number of users.
- Also, we can specify the ramp-up time in seconds which denotes the time period in which all the user threads must start.
- Save the JMeter script as a .jmx file.
- Now to run the JMeter script for load testing you can use your local machine if that suits you. We chose to run it on the cloud. Since we had a company AWS account, we decided to go with Redline13 which uses our AWS account where we can select a spot instance of any server to load the performance test. This can help in avoiding network bottlenecks at your workplace.
- The free version of Redline13 allows you to test but would not allow you to access JMeter logs if you have any. But the errors are displayed on the test page but up to only 500 in number so you can name your JMeter requests accordingly including any relevant JMeter variable to get its value in the error list. Our web app is hosted on Azure, so we had our Application Insights in the Azure dashboard to monitor the web app’s health.
- This blog post from Redline13 explains the steps in detail.
- When you are using third-party plugins in JMeter scripts, it is important to add all the used plugins to the test configuration page in RedLine13 with the correct version.
- Also, if you’re using WebSockets in your JMeter script check the WebSockets checkbox in
Jmeter Plugin box in the test configuration page
Thus, the combination of JMeter and Redline13 can be a right fit to performance test a complex web application for finding its limit scenarios.
Overall, SignalR JMeter is a useful tool for performance testing of real-time web applications built using SignalR technology. It can help testers identify potential issues and optimize the performance of the application, leading to improved user experience, increased customer satisfaction, and potentially, increased revenue.
Contact us if you require any assistance with this. The entire process can be made easier for you by our team.
Ready to turn your idea into a powerful digital solution?
Partner with our experts to design, build, and scale technology tailored to your business goals.
Contact us Today