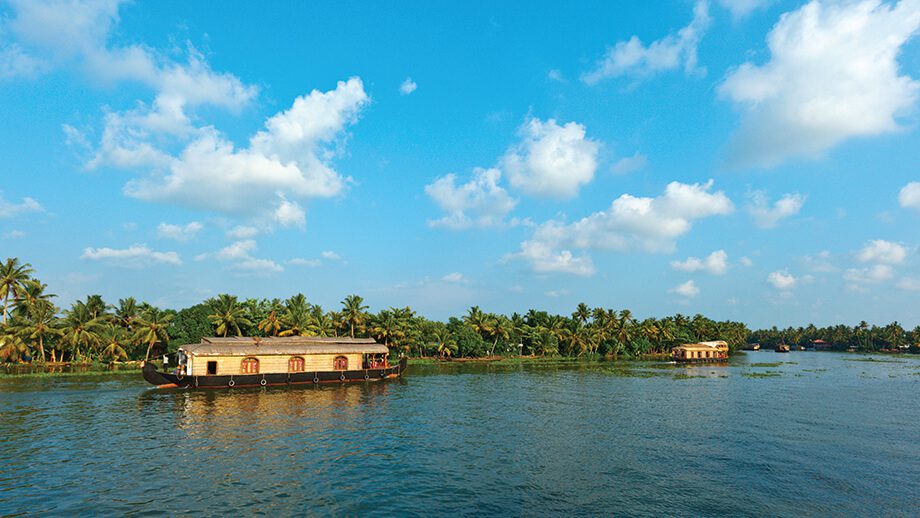
Ashtamudi Lake, the second largest and deepest wetland ecosystem in Kerala has multiple branches and gateways to the backwaters of the state. Ashtamudi Wetland with eight creeks flourished with immense flora and fauna was included in the list of wetlands of international importance, as defined by the Ramsar Convention for the conservation and sustainable utilization of wetlands.
Degradation of water quality is one of the major concerns that our water bodies are facing for a very long time. Ashtamudi lake is no exception from this as it is under intense anthropogenic pressure. Large quantities of untreated sewage, urbanization practices, oil spills, and hydrocarbon discharge from fishing boats have deteriorated the water quality of the lake over years. One of the parameters to weigh the water quality is Total Suspended Matter (TSM) which is the suspended particles that are not dissolved, in a sample of water and those that can be trapped by a filter. This study focuses on finding the total suspended matter that has accumulated over these years in Ashtamudi Lake using the ODC platform inspired by several case study jupyter notebooks including the ones found in DE Africa.
The study depends exclusively on Landsat-8 data and in order to analyze the TSM extent we have selected data belonging to two time periods 2014 and 2019 for the months January to March. This time frame was selected because of the lack of rainfall during these months to obtain a rain uninterrupted result.
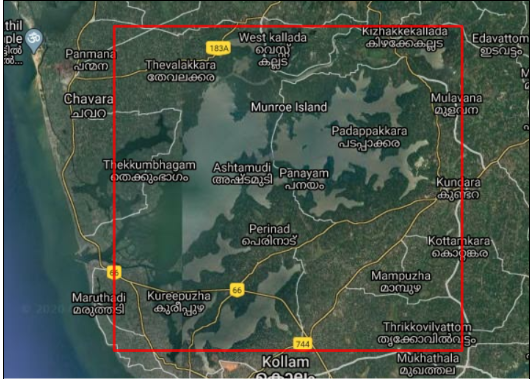
Fig 1: Area selected for the study
Landsat-8 data is a surface reflectance product, and since water has a very low radiance, the accuracy of the results can be impacted by small differences in atmospheric conditions or differences in atmospheric correction algorithms. It is also possible to increase the accuracy of these water quality results with an in-situ sampling of water bodies, but the result of this study is purely on spatial data. In the analysis, Water Observations from Space (WOfS) product is used to mask out non-water pixels so that the quality check is applied just to the areas with water presence and then we generate the median composite for the intended time period. Using Lymburner Total Suspended Matter (TSM) Lymburner et al. 2016 algorithm for Landsat 8 we calculated the TSM rate in mg/L concentration.
LYM8 = 3957 ( (Green + Red) 0.0001 2)1.6436
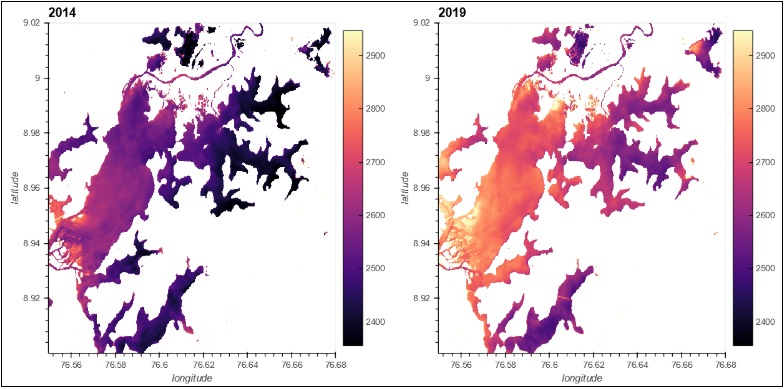
Fig 2: TSM analysis for the year 2014 and 2019
In the Total Suspended Matter plot, the Black region represents Low TSM, the Purple region represents Medium – Low TSM, the Orange region represents Medium – High TSM and the Yellow region represents High TSM. So, it is evident that the TSM values are lower in the year 2014 as compared to 2019. The turbidity rate has increased with time causing depletion of water quality in Ashtamudi Lake and has spread across the lake over the years.
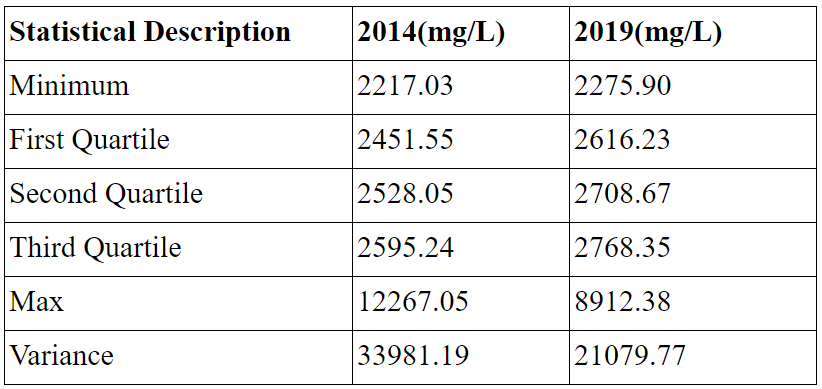
Table 1: Statistical description of TSM analysis
The quantile representation gives us a better idea about how the values in the data are spread out. The table shows the increment in TSM from 2014 to 2019. The first quantile (25th percentile) second quantile (median) and the third quantile (75th percentile) data shows more than 50 mg/L increment in the suspended matter in 5 years of time.
To recapitulate, Ashtamudi lake is now in the midst of deterioration, accumulation of sediments, waste disposal, and above all losing its aesthetic values. The lake is turning out to be another victim of man vs environment conflict.