Overview

Ensure cargo and crew are safe with ship inspection analysis using Power BI. Checklist creation must be streamlined for scattered ship inspection data from 540 inspections on 32 ships. Navigating ship inspection jargon, risk classification, and data preparation hurdles demanded Power BI’s expertise for resolution.
- Developed the Power BI project dashboard for inspection data.
- It includes the number of inspections, ships, inspection period, and risk score to ensure the ship’s seaworthiness.
- A customized and simplified checklist was developed to ensure ship quality and save billions lost to shipwrecks.
Case
Ships are an important part of transportation services. They are widely used to transport cargo especially in very large quantities via sea over long distances. The majority of international trade is handled by thousands of cargo carriers that travel the world’s seas and oceans every year. They are usually specially designed for the task, often being equipped with cranes and other mechanisms for loading and unloading cargo. As such ships play an important role in international trade, it is thus equally important to ensure that these ships are in a good condition or in other words ensure that they are seaworthy. Any damage to ships during travel can lead to loss in millions or billions of dollars and thus ship inspections are mandatory. In order to ensure maritime safety and security, prevent pollution, and ensure that the condition of the ship and its equipment complies with the requirements of international regulations, a ship inspection analysis using power BI is required. A ship inspection consists of a set of procedures or a checklist. This is usually done periodically to ensure the safety of the ship crew as well as the cargo it is transporting. The checklist consists of a long list of regulations that is to be verified by the ship inspector within an allotted interval of time. In most cases, it is not possible for them to validate all items in the checklist within the allotted time. This project thus focuses on ship inspection analysis using Power BI. It involves developing Power BI dashboards based on previous ship inspection data and crew information to generate a consolidated checklist. This consolidated checklist will be different for each ship and will be based on its previous inspection reports. Having a smaller and prioritized list, makes the ship inspection easier and also more effective.
Challenges
Ship inspections data consisted of the previous inspection history for different ships. The data consisted of 540 inspections conducted on 32 ships. The main goal of this project was to generate a consolidated checklist for more effective inspections.One of the main challenges we faced was to get ourselves more accustomed to the ship inspection terminologies and how the inspectors classify an observation as a risk or not. After that we had to develop our own calculations to generate a consolidated list.
Second challenge we faced was in preparing the raw input data. The inspection consisted of a few Excel files. We had to leverage the functionalities in Power BI to clean and transform the data and also to define relations between the different data files.
Solution
The project dashboard was developed in Power BI. The home dashboard contains a summary of the inspection data with information about the number of inspections done, number of ships inspected, the period of inspection and risk score.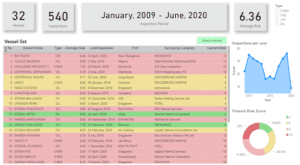
There basic information about the ships is displayed in the table. The data is arranged in such a way that the ships having lower risk (in good condition) are highlighted in green, ships having medium risks are highlighted in yellow and high-risk ships are highlighted in red. ‘Select a Vessel’ button appears in disabled state. On selecting any vessel in the table, the button gets enabled with a new message ‘View Vessel data’. Clicking the button takes users to a different page having ship data.
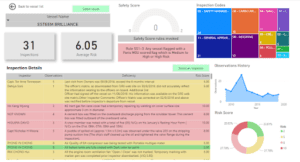
The second page shows the inspection of the ship, such as the inspector’s name, number of observations found, the risk score given by the inspector etc. This inspection history data is used to generate a consolidated checklist. There is also an option here to navigate to Inspector’s page by selecting an inspector and then clicking on the green button. To arrive at a consolidated inspection checklist, RFM analysis was done. The risks identified were categorized into three categories based on how recent it occurred, how frequently the risks were identified and also the number of observations for each risk. These three categories are also displayed along with the personalized checklist providing users the flexibility to customize and prioritize the checklist as required.
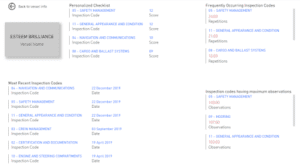
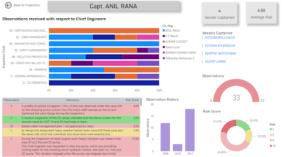
The second requirement of the project was to provide a summary of the ship inspectors and also the ship masters. A different page is created for the ship inspector which gives information about the inspections conducted by the inspector, along with the deficiencies identified during the inspections and the risk score assigned against each deficiency. Also, for each ship inspected, the name of the ship master and chief engineers are also provided. This information can help understand if inspectors are properly covering the checklist.
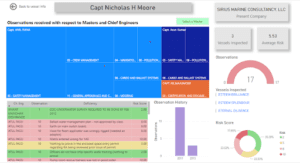
Also, there is a different page for ship masters which shows the different vessels they captained, and the deficiencies found in their ships. This can provide information on how the masters are managing the ship and what all areas they should be focusing on to reduce the number of deficiencies.
Impact
This project has helped to make the ship inspection process more efficient by providing a customized and simplified checklist for each ship so that all critical areas can be covered within the allotted time period. Also, this project was able to summarize the past inspection data and also help to understand the performance of ship inspectors and masters. Having an effective inspection can ensure the quality of ships and save billions of dollars lost due to shipwrecks.
