Being an agrarian economy, weather and climate play a vital role in India’s economic development. India’s geography and geology are pivotal for weather events. Besides economic backslide, the vagaries of weather cause loss of human life, agriculture, and property.
The state of Kerala receives rainfall around 6 months a year in the form of pre-monsoon (mango showers) monsoon, retreating monsoon rains. Steady monsoon and salutary climate remain a hallmark of Kerala. The variation in the annual rainfall in Kerala is small when compared with other parts of the Indian subcontinent. However, there were a few uncharacteristically wet years for Kerala which includes the one in 1924 with a total of 3368mm of rain recorded for three weeks and the recent 2018 flood. According to IMD, the rainfall amount between June and August 2018, was 50% less than the 1924 event but was still 36% more than the normal rainfall for that period. As per the report of the World Meteorological Organization (WMO), the floods in Kerala were among the worst of its kind in the world in 2018.
A Dive Through Data Cube
Amidst different methods of tracking the effects of floods and other disasters, satellite remote sensing is an excellent tool in managing disasters. In this era, we have got plenty of remote sensing data that can serve this purpose. The number of countries participating in Earth Observation and remote sensing is increasing day by day and in the present time, several platforms collect, process, and analyze large amounts of data from satellites using different methods and known algorithms. Open data cubes are one such platform that helps in satellite monitoring.
Open Data Cube being an efficiently indexed file system for satellite imagery, helps to innovate a better world, empowered by increasing the impact of EO satellite data. The technological solutions of the ODC platform remove the burden of data preparation, assists in acquiring quick results by making data queries easier and promotes an active and engaged global community of contributors. They also enable efficient time-series analysis.
Technically, ODC is made up of three components – the satellite data, a database to store the indices of the data for faster retrieval, and software to view and analyze the data. The core of Open Data Cube is a set of python libraries and PostgreSQL database that enables you to work with geospatial raster data.
Kerala Cube
Floods are among the most frequent and costly natural disasters in terms of human hardship and economic loss. So, a dependable flood map is one of the present-day concerns of flood management. In the study conducted by TA, satellite-based data was used to map the flood inundation. The flood delineation was enabled with Landsat-8 images using an open data cube platform. A comparative study on pre-flood, water-covered, and post-flood periods based on Normalized Difference Vegetation Index (NDVI), Modified Normalized Difference Water Index (MNDWI) and Normalized Difference Built-up Index (NDBI) were carried out using satellite dataset. In short, the study enabled us to view land cover changes that took place throughout the year 2018 especially the green coverage, water extent, and built-up.
With the help of Jupyter notebook that uses Python programming language, the study could cover any affected region within Kerala but as an instance, we have taken an area within the latitude range (9° 26′ – 9° 4′ N) and longitude range (76° 51′ – 76° 65′ E), one of the most hit areas that lie adjacent to river Pamba.
A Study on Spectral Classification
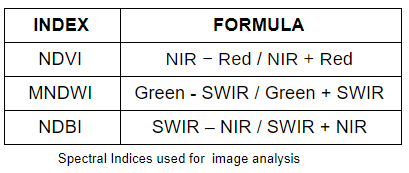
The vegetation change pattern is estimated using the Normalized Difference Vegetation Index (NDVI), which is based on visible (RED) and near-infrared (NIR) band reflectance and Modified Normalized Difference Water Index (MNDWI) for enhancing and extracting open water features while efficiently suppressing and even removing built‐up land noise as well as vegetation and soil noise. MNDWI uses visible (GREEN) and SWIR bands for the enhancement of open water features. Similarly, the build-up areas and soil reflect more SWIR than NIR which helps the Normalized Difference Built-up Index (NDBI) utilize these properties and give negative values to water bodies and higher values to represent build-up areas.
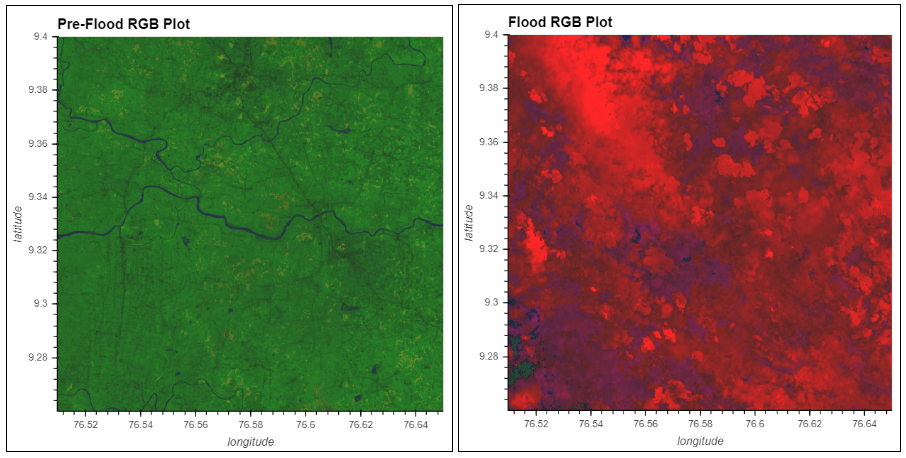
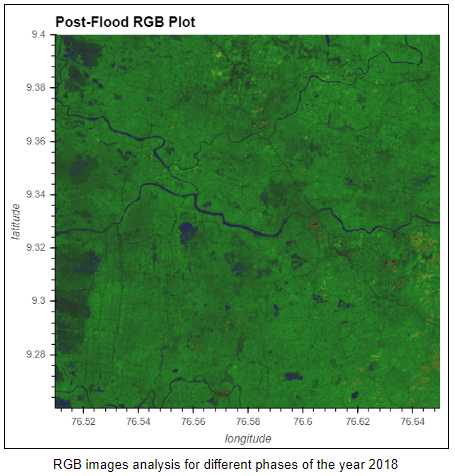
The resultant bands were combined to prepare an analysis RGB (Red – Built-up/mud, Green – Vegetation, Blue – Water) image. The RGB view of the selected region from Landsat-8 for all three of the periods (pre-flood, during flood and post-flood) are shown below:
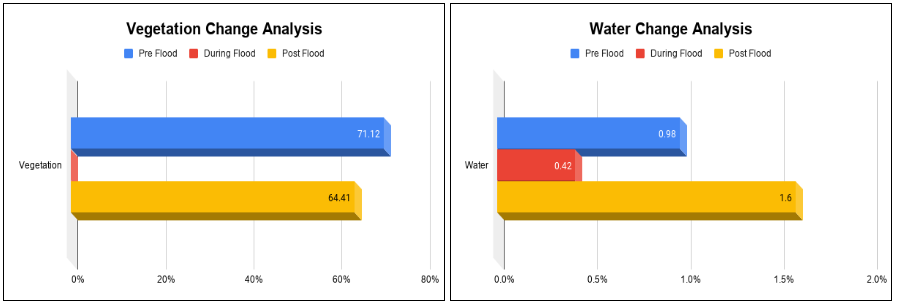
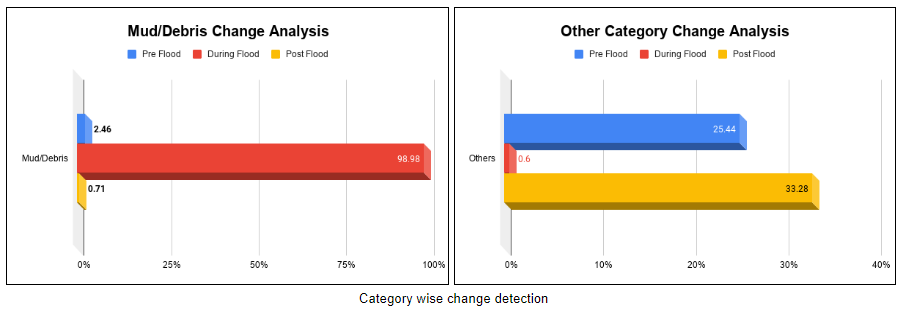
Land Cover Change
Through the statistical analysis, with a threshold value for each category and season, it was found that there has been a substantial decline of over 6% in the vegetation and an increment in water coverage after nature’s rage over Kerala. From the literature review and other mediums, it was noted that during the flood and post-flood, one of the greatest challenges that people faced was the accumulation of mud and debris. Along with this, the lack of cloudless satellite images and the frequency of image availability (16 days) also tampered the quality of study over the flood time analysis. The compromised quality could be noted from the flood time RGB images above. During the period of flood, the entire region was mud and debris covered which could explain the abundance of mud coverage. A graphical explanation of the situation over the year could give more insights into the study.
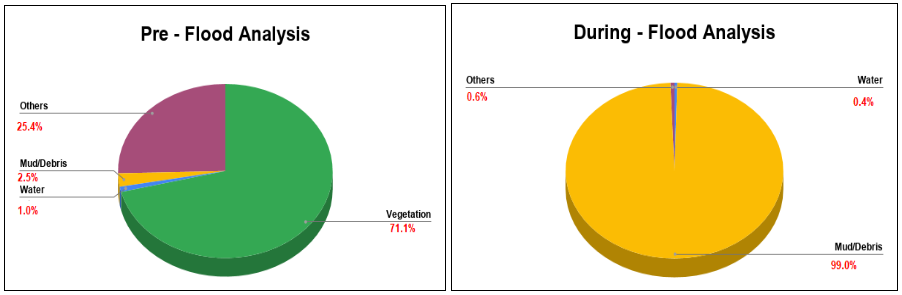
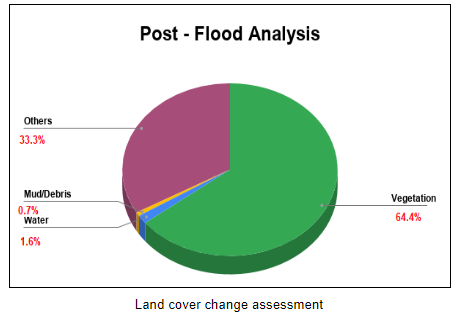
Category-wise analysis of flood brings us to the conclusion that the vegetation cover has been affected by the water rush and even after the flood, water presence is evident in the affected areas which could lead to concomitant environmental and social problems.
Further Benefits of the Study
The situation was regularly monitored by the National Crisis Management Committee, which also coordinated the rescue and relief operations along with the Government of Kerala. According to the government’s estimate, a total of 4,537 from the fishermen’s community participated in the rescue operation with 669 fishing boats. Even though the damage caused by the unfortunate event trashed Kerala environmentally, economically, and socially, the people of Kerala overcame it successfully and once again proved with time that nothing can hold back the state.
Remote sensing can help cover a larger area than any other platform to analyze damage detection in natural disasters. These kinds of analysis using satellite images can be utilized in different phases of disaster management such as prevention, preparedness, relief, reconstruction, warming, and monitoring and will create scope for further analysis for disaster management. Therefore, during the flood prevention phase satellite data and GIS analysis can help in hazard and risk assessment, during the flood time these data can be used for emergency operations and during the relief and rehabilitation phase one can use these analysis data for damage information and in the evaluation of sites for reconstruction.
Ready to turn your idea into a powerful digital solution?
Partner with our experts to design, build, and scale technology tailored to your business goals.
Contact us Today