Power BI is one of the most prominent business intelligence & data visualization tools in the market right now. With teams who are Microsoft-centric adopting it readily, its popularity has grown substantially in the last few years. But Power BI, despite its strengths, comes with a unique set of challenges. From DAX complexity and steep learning curves to scaling issues and opaque pricing, it is far from a perfect fit for every organization. Luckily, in 2026, Power BI is no longer the only credible BI option. Many tools have come up with features that make them more accessible for teams with limited analytics experience while delivering exceptional value and performance to their users. The right business intelligence tool must be one that satisfies your unique business needs, scalability requirements, and data handling workflows. In this blog, we are exploring the top 7 Power BI alternatives or competitors that can turn data into business decisions without the added complexity and high price tag. So if you are evaluating a modern, streamlined alternative to Power BI, this is your comprehensive breakdown of the key options, with clear comparisons of pros and cons and who they are best suited for.
What is Power BI?
Before exploring its alternatives, first let’s understand what Power BI is. Power BI is Microsoft’s native business intelligence and data visualization tool designed to turn data into reports and dashboards. It is part of the Microsoft 365 ecosystem, which makes the integration with Excel, Azure, SQL Server, etc. seamless. Built around a columnar data model and an in‑memory engine (DAX engine) for fast query performance, it has three main components, namely:
- Power BI Desktop is the free Windows application that can be used to build data models, transformations, and visuals
- Power BI Service (SaaS application), a cloud-based portal meant for publishing, sharing, scheduling, and managing data, and
- Power BI Mobile lets users view the dashboards and reports on their phones and laptops in real time. The app is compatible with iOS, Android, and Windows devices.
Using these three components, Power BI can efficiently support self-service analytics for business users and governed enterprise reporting alike. Power BI is a strong tool for data visualisation with its custom charts, maps, tables, etc. It uses a licensing model with free, Pro, and Premium tiers, each unlocking additional capabilities. Mostly used by organizations that are already invested in Microsoft products and cloud services, Power BI aims to bridge the gap between data‑engineering work and business‑user decision‑making in a single environment.
Why Consider Power BI Alternatives?
While considering a business intelligence solution for a team, it is important that the BI platform’s strengths match the team’s skills, workflows, and growth plans. Even though Power BI is a powerful data visualization engine that is deeply integrated with the Microsoft ecosystem, it is definitely complex and certainly not universally optimal. Here are a few reasons why teams are increasingly looking out for Power BI alternatives.
1. Steep learning curve for advanced data analytics
As explained before, Power BI’s core logic lies in DAX and the semantic data model, which are powerful but not intuitive for beginners and non-technical users. Advanced features like time-based calculations, complex metrics, and context-aware analytics often require specialized expertise. Without experienced data modeling or BI professionals, teams may rely on trial and error, take longer periods of time to build reports, and become more dependent on IT or analysts, which then slows down decision-making.
2. Complexity while dealing with large datasets
Analysing large datasets with Power BI becomes difficult, especially if the data volume grows beyond the in-memory model’s capability. Such heavy datasets often would require users to resort to temporary fixes and workarounds such as incremental refresh, composite models, or DirectQuery. This, in turn, adds architectural and governance complexity. Poorly built data models can quickly become unstable under heavy filters or complex measures, leading to frustrating user experiences and slow report generation.
3. Licensing and Pricing Structures
Microsoft Power BI offers attractive entry-level pricing through its Free and Pro tiers. But costs rise significantly once organizations require enterprise-scale capabilities such as large semantic models, advanced AI features, higher refresh limits, governance controls, or broader report distribution. Access to many of these capabilities is tied to their Premium licensing, which represents a substantial pricing jump and often bundles features organizations may not fully utilize. For growing businesses and mid-sized teams, this can create an unfavorable cost-to-value equation, particularly when only a limited subset of advanced functionality is required. Organizations operating outside a Microsoft ecosystem may face added complexity in maximizing the platform’s value. As a result, many enterprises begin evaluating alternative BI platforms that offer more modular pricing, flexible scalability, and feature-specific cost structures aligned to actual usage.
4. Limited flexibility for non‑Microsoft ecosystems
Power BI is tightly woven into the Microsoft ecosystem, with it seamlessly integrating with Azure, SQL Server, Excel, etc. And it is worth noting that Power BI’s strongest optimizations are tilted more toward Microsoft clouds and services. But this tight coupling can become a drawback, especially for teams heavily invested in Amazon Web Services (AWS), Google Cloud Platform (GCP), or open-source stacks. Such teams might opt for business intelligence solutions that are more open-source friendly or multi-cloud agnostic to reduce friction with existing ecosystems and prevent licensing lock-in.
5. Need for modern AI‑driven insights
Even though Power BI’s integration with Microsoft Copilot brings in an AI edge to the platform, it is still lacking the AI-first ideology at its core. Power BI supports AI-powered anomaly detection, forecasting capabilities, and a new feature where users can ask questions, which will generate relevant data-backed answers. However, it is worth noting that these features are layered on top of a traditional BI model rather than reshaping the user experience as a whole. In practice, organizations still need well-structured data models, optimized relationships, DAX calculations, and curated dashboards before these AI features can deliver meaningful results. This creates a dependency on data analysts or BI specialists to prepare and maintain the analytical environment. Teams now want AI-first, conversational, or fully automated report generation tools rather than a business intelligence monolith system. Organizations seeking broader self-service analytics adoption and lower reliance on technical teams often evaluate newer AI-native platforms that prioritize accessibility and automation over traditional BI engineering workflows.
5. Operational and Governance Overhead
Managing permissions, workspaces, datasets, security rules, and deployment workflows in Power BI can become complex as usage grows across an organization. For companies trying to scale analytics across multiple teams and applications, controlling who can access what data and when can quickly become tedious and time-consuming. This often creates operational bottlenecks and increases dependence on dedicated BI administrators. In comparison, platforms with simpler governance models, easier embedding capabilities, and more streamlined access controls can reduce this complexity and improve adoption across business workflows.
Consider a Power BI alternative when you value simplicity, speed‑to‑insight, cost‑predictability, and inclusivity over deep Microsoft integration
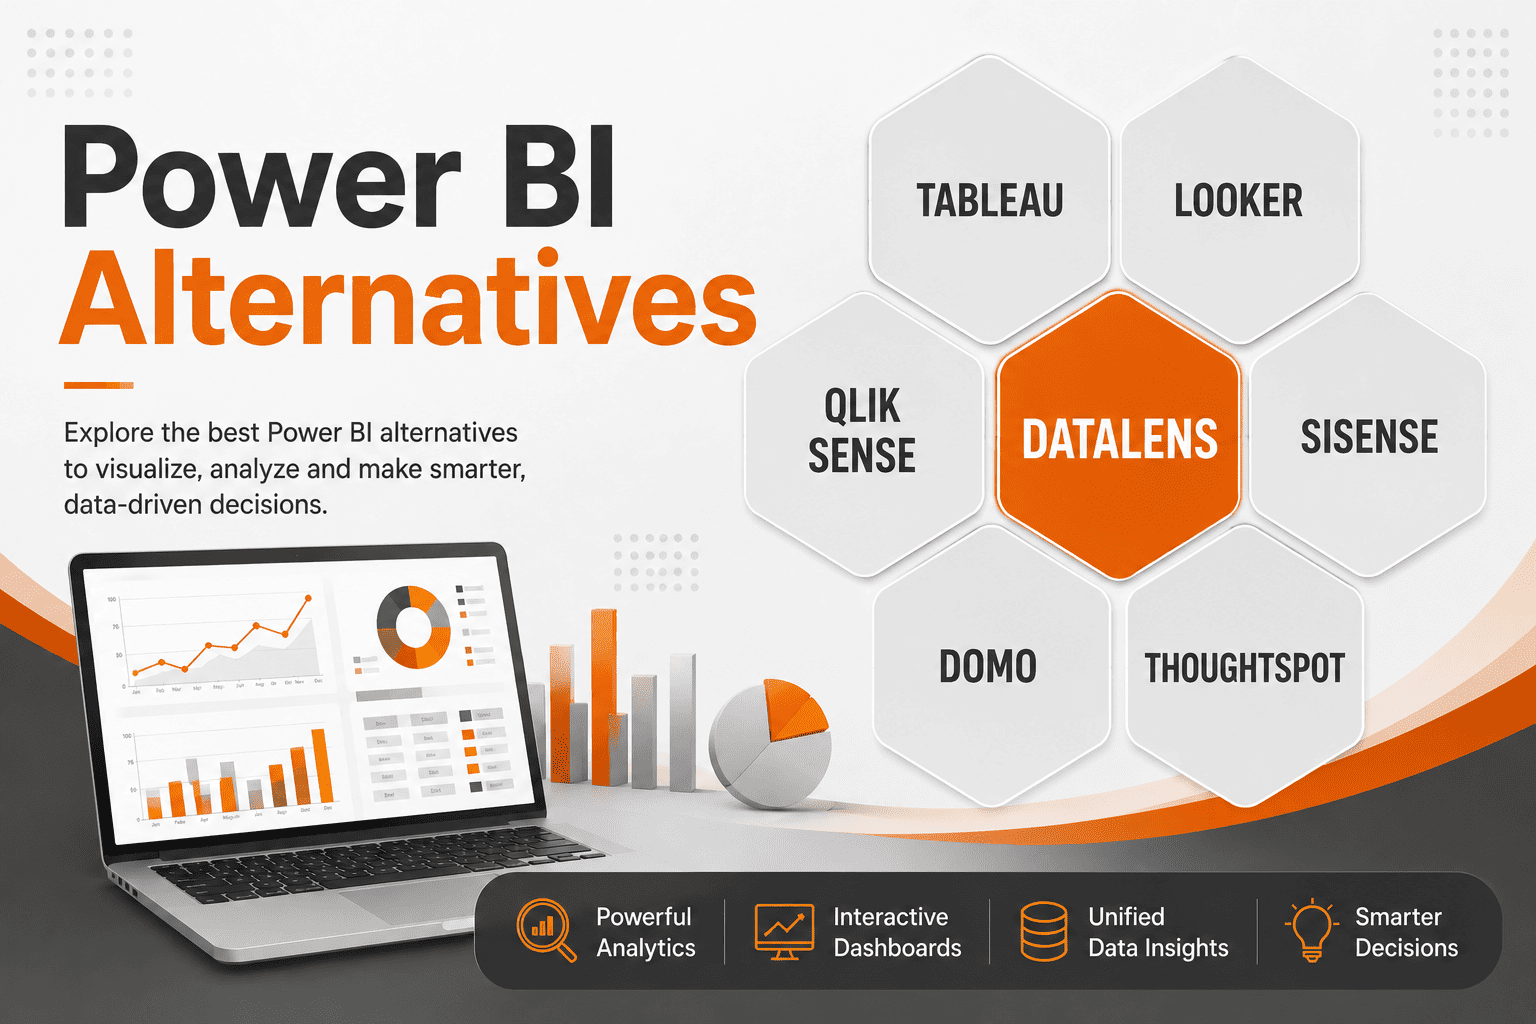
Top 7 Power BI Alternatives
1. DATALENS
DataLens is a 360° AI‑based data intelligence platform developed by Travancore Analytics aimed at simplifying data analytics and business intelligence for non-technical users. DataLens analyses uploaded data from disparate sources of varied formats to automatically generate comprehensive business reports with visual elements. The platform has AI deeply integrated at its core, which helps in relationship mapping, generating key insights, conducting data gap analysis, and autonomously suggesting next steps. With its intelligent AI chatbot integration, users can interact directly with their data using natural language to extract just the necessary data points. DataLens enables users to visualize data with their smart, dynamic dashboards. DataLens has a unique AI widget maker, which lets users create custom widgets or dashboards with prompts in plain language.
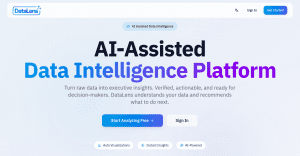
Unlike other business intelligence tools that provide an analysis on only the existing data, DataLens gives context-aware suggestions, trend prediction, revenue‑stream discovery, and risk‑mitigation recommendations. It also helps businesses identify their ideal customer profiles, buyer behavior, etc., which can help in curating user experiences. Additionally, the DataLens engine can also act as an independent module, which could be deployed in an organization’s own infrastructure with zero dependency on the DataLens API or UI. This flexibility ensures that organizations have full control of their data in their private environment.
Get a Free Demo
Pros
- Deep AI integration automates relationship mapping, insights, next steps, and data gap analysis
- no‑code or low‑code experience; no SQL or analytics background required to use
- AI chatbot and widget maker reduces dependency on analysts and developers
- strong data‑privacy and “no persistent storage” model
- fast report and visualization generation from CSV, Excel, S3, and direct DB connections
- Industry-agnostic, DataLens supports cross-industry use cases (manufacturing, healthcare, EdTech, retail, finance, sales & marketing, etc.)
- helps uncover ICP, hidden revenue streams, and inefficiencies
- lightweight and fast to onboard for teams that want AI‑first insights, not full BI governance
Cons
- limited third‑party connector ecosystem compared to established BI tools
- focuses on uploaded or batch‑connected data rather than rich live‑querying and composite models
Best For: Mid‑sized or growing teams looking for AI‑assisted reports, smart dashboards, and automatic recommendations without investing in deep BI infrastructure or hiring specialized analysts.
2. TABLEAU
Tableau is an advanced BI platform popular for data visualization and interactive reporting, especially tailored for data teams and enterprises needing deep exploratory analysis. Tableau supports flexible deployment across cloud and self-hosted environments. Similar to Microsoft Power BI, Tableau enables deep drill-down analysis and interactive exploration of complex datasets through intuitive dashboards and visual analytics. Its proprietary drag-and-drop VizQL engine translates user interactions into optimized queries, allowing users to build visualizations and explore data without extensive coding.
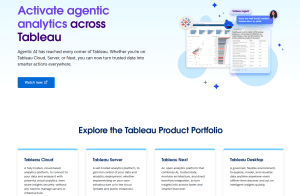
To make data visualisation accessible for non-technical users, Tableau offers Tableau Next, its next-gen agentic AI engine. It enables users to receive automated insights, contextual recommendations, and proactive alerts directly from their data. It supports natural language querying, allowing users to ask business questions in plain English and explore data conversationally. Tableau Next also integrates with workflow platforms such as Slack and Salesforce to trigger notifications and surface insights within operational workflows. Tableau harbors an extensive community of users with tutorials, templates, and a cumulative visualization library.
Pros
- intuitive drag‑and‑drop analysis without heavy coding
- AI‑driven insights and agentic analytics in Tableau Next
- proactive insight delivery and action triggers in external tools
- strong security, governance, and reusable metrics layer
- flexible deployment (cloud or on‑prem) for enterprises
- large ecosystem of connectors, templates, and community support
Cons
- Steep learning curve for advanced features and analytics
- Proper data governance and analytics often require add-ons such as Tableau Catalog, Tableau Pulse, Data Management, etc., which add licensing costs and complexity
- Licensing becomes costlier for large teams with a price-per-seat costing structure
- External data‑prep tools are often required for complex pipelines
Best Suited For: Enterprises that prioritize advanced visualization and flexible cloud/self‑hosted deployment, who are willing to invest in licensing.
3. LOOKER
Looker is a business intelligence platform owned by Google. It is deeply integrated with the Google ecosystem. Looker’s most distinctive feature is LookerML, a modelling language that acts as a semantic layer between the raw data and business users by defining dimensions, calculations, and data relationships. This creates a unified data model that could aid cross-functional operations across the organization. Additionally, Looker supports Git-based version control for data models, enabling teams to track changes within existing developer workflows. However, business users need at least a basic knowledge of coding to make use of LookML, which increases reliance on technical and data teams.
Looker has a warehouse native architecture model, which queries live data directly from data warehouses rather than importing historic data. With its mature embedded analytics capabilities, APIs, SDKs, and white-label customization options, Looker enables businesses to build tailored analytics experiences and integrate data insights directly into their own applications and workflows. And Looker can be integrated with websites, portals, and applications for advanced analytics. With Looker being integrated with Google’s native AI assistant, Gemini, users can enjoy conversational analytics by prompting the engine in natural language.
Pros
- Warehouse‑native model for live querying and avoiding data duplication and sync issues
- Excellent for embedded analytics and custom application integration
- Developer‑friendly with Git‑based modeling, version control, and rollback
- scalable for large data volumes and user bases in the cloud
- Conversational analytics (Gemini) improves accessibility for non‑technical users
- Tightly integrated with Google’s workflow and ecosystem
Cons
- LookML has a steep learning curve and requires relying on developers or data engineering teams
- With warehouse native architecture, model changes and governance still require coordination with warehouse‑level and catalog‑level controls
- Coupled closely to Google Cloud, leaving multi‑cloud or non‑GCP environments feeling constrained
- Setup and customization depend on SQL and LookML expertise
- Non-technical users may struggle with authoring or debugging models
Best Fit for: Data teams and organizations that want a governed, warehouse‑native, metric‑consistent BI platform. Looker is a perfect fit for organizations that tightly integrate with Google Cloud and analytics embedded into internal or customer‑facing applications.
4. SISENSE
Sisense is a well-rounded business intelligence platform that combines data pre-processing, analytics, and visualisation. Sisense features a unique in-chip processing technology that helps in processing and analyzing big data faster. The platform’s flexible and scalable architecture has proved itself to be optimized for high volumes of workloads. It also features drag-and-drop tools to stay accessible for non-technical business users, especially for building custom dashboards.
Sisense is strongly designed for embedded analytics, allowing businesses to integrate dashboards and insights directly into their own applications or customer portals. It also supports multi-tenant governance and data isolation, meaning SaaS companies can securely provide separate, personalized analytics environments for different customers while keeping each customer’s data isolated and protected.
Pros
- efficient handling of large datasets via in‑chip processing
- flexible deployment (cloud, on‑prem, hybrid)
- highly developer‑friendly with extensive APIs and customization options
- supports branded, white‑labeled dashboards inside customer‑facing products
Cons
- Complex initial configuration for non-technical users
- Initial setup and embedded analytics integration can slow time‑to‑market
- Pricing can be high, especially for scaled embedded analytics capacity
Best Fit for: Sisense is mostly a BI solution targeted at mid‑to‑large enterprises and SaaS vendors. It is most suited for organizations building analytics into customer‑facing products and applications that need multi‑tenant architecture, data isolation, and heavy‑duty embedded analytics, given that they have a dedicated development team to manage integrations.
5. QLIK SENSE
Qlik Sense is a business intelligence platform that is built around an associative data engine that explores data relationships and hidden patterns rather than relying on fixed queries and pre-defined dashboards. While it might not be suitable for organizations looking for standardized reporting workflows, Qlik enables a non-linear, exploratory analysis across complex, interconnected datasets.
Qlik uses a scalable in-memory associative engine that maintains relationships across datasets and instantly updates related associations and exclusions when users interact with data. In addition to this, Qlik Sense uses Qlik Data Integration (QDI) and change data capture (CDC) to detect, acquire, and transfer real-time data changes instantly between databases, applications, and analytics platforms. Qlik offers AI-powered augmented analytics with natural-language search, automated insight generation, trend detection, predictive assistance, and AI-assisted visualizations.
Pros
- Associative engine enables exploratory analytics that query‑based tools cannot replicate
- excellent for uncovering hidden relationships and unexpected patterns in data
- strong real‑time and CDC‑based data‑integration capabilities
- handles large, complex datasets efficiently with in‑memory associative indexing
- powerful AI‑assisted insights and predictive analytics layer
Cons
- Associative model requires a different mental model and learning curve
- Self-hosted deployments need significant infrastructure management and tuning
- Non-technical users may struggle without guided templates or stronger self‑service scaffolding
- reporting can feel less “standardized” than classical BI in tightly controlled workflows
- performance can dip on very large or poorly modeled models without optimization
Best Suited For: Organizations that need exploratory analytics across complex, interconnected datasets, strong governance, and real‑time or CDC‑driven pipelines, with the technical capacity to manage infrastructure and licensing, can benefit from Qlik Sense.
6. DOMO
Domo is a cloud BI platform that can connect to several data sources for SaaS, databases, cloud, and custom APIs. Domo lets users build custom real-time interactive dashboards, which are built for easy sharing, embedding, and cross‑team collaboration. It is an all-in-one platform combining data integration, dashboards, automation, end-to-end analytics, and AI-driven actionable insights.
Domo combines AI-powered insights, conversational analytics, and AI agents with built-in automation capabilities that help organizations drive actions and decision-making directly from analytics workflows. Domo uses Magic ETL to let users build no-code data pipelines, track how data moves through workflows (lineage), and manage changes through version history. The platform provides an intuitive no-code analytics environment with reusable governed metrics and business-focused applications designed for non-technical users.
Pros
- Single platform for data integration, ETL, visualization, automation, and AI
- Semantic layer ensures metric consistency across dashboards
- AI‑driven Q&A and chat let non‑technical users query data directly
- strong real‑time and mobile‑first experience
Cons
- Learning curve increases with the breadth of modules and capabilities
- advanced customization tightly tied to Domo‑specific tools and syntax
- not always the cheapest fit for budget‑constrained SMBs
Best Fit for: mid‑to‑large teams wanting a single, real‑time, all‑in‑one BI platform across data integration, dashboards, automation, and AI actions.
7. THOUGHTSPOT
ThoughtSpot is an AI-driven analytics platform built around a search-first, natural-language interface that enables self-service analytics for non-technical users through plain-language queries. Its AI assistant, Spotter, can instantly convert questions into charts, tables, visualizations, and story-driven dashboards using Spotter-Viz without requiring manual dashboard design.

ThoughtSpot also offers interactive Liveboards that update in real time and respond dynamically to user queries. With strong embedded analytics capabilities through ThoughtSpot Embedded, organizations can integrate analytics directly into applications and workflows. The platform is designed to handle extremely large datasets with fast query performance while supporting both cloud and on-premises deployments. Additionally, AI agents automatically surface anomalies, trends, and contextual explanations from live governed data, reducing reliance on heavily pre-built dashboards and aligning closely with modern cloud data warehouse architectures.
Pros
- Natural language search drastically lowers the barrier for non‑technical users
- Reduced dependence on IT and analysts for routine reporting and exploration
- AI‑assisted insights and agent‑driven analytics
- Liveboards and Spotter reduce manual dashboard design and formatting work
Cons
- Natural-language search works best with a clean, well‑modeled data layer, which means setup and modeling require upfront investment
- Implementation and tuning can have a high learning curve for technical teams
- Advanced customization options are more limited than open‑BI or code‑heavy tools
- governance and cataloging still need to be managed alongside warehouse‑level controls
Best Suited for: Best for organizations that want AI‑powered, search‑first, self‑service analytics with natural‑language querying and auto‑generated dashboards. Thoughtspot works well with teams who do not want to rely heavily on traditional BI workflow structures or hand‑crafted dashboard development.
How to Choose the Right Power BI Alternatives for Your Business?
Choosing a Power BI alternative isn’t about finding a perfect clone. It’s about identifying a platform that better matches your team’s skills, data maturity, and growth plans. Start by clarifying what specifically is painful in your current setup.
Is it DAX complexity, cost, slow time‑to‑insight, poor self‑service, governance issues, or difficulty embedding analytics into tools and products?
-
Match the tool to your team’s analytical maturity
If your users are mostly non‑technical and want quick answers, prioritize search‑driven, AI‑assisted platforms with natural‑language querying and guided analytics. If you have strong data engineers and analysts, a more model‑centric, governance‑heavy tool may be appropriate.
-
Evaluate data architecture and connectivity
Decide whether you need a warehouse‑native, live‑connection tool or are okay with import‑based, in‑memory models. Check connectivity to your actual stack: cloud data warehouses, databases, SaaS tools, and on‑premise systems. Ensure the platform supports the sort of ETL you practice, whether built‑in (Power Query–style), managed externally, or handled via a separate pipeline.
-
Consider governance, security, and scalability
Enterprise teams need row‑level security, centralized metrics, audit logs, and role‑based access. For large deployments, look at how the platform scales, handles concurrent users, and manages complex data models. Some tools bake governance into the semantic layer; others require add‑ons or extra configuration.
-
Assess self‑service and ease of use
If your goal is to reduce dependence on IT, focus on platforms with intuitive dashboards, drag‑and‑drop builders, and conversational AI that let business users explore data without SQL or DAX. Watch for tools that still require significant developer effort for setup or advanced features.
-
Think about embedded analytics and productization
If you’re building analytics into customer‑facing products or internal apps, prioritize tools with strong APIs, SDKs, white‑labeling, and multi‑tenant capabilities. Embedded analytics often requires different pricing and architectural patterns than internal dashboards.
-
Factor in total cost of ownership
Look beyond headline pricing. Consider licensing models, growth costs, added modules (catalogs, data management, governance), and the cost of training and maintenance. Some platforms are cheaper upfront but expensive at scale; others are higher‑priced but reduce long‑term overhead.
A good Power BI alternative should make your analytics simpler, faster, and more accessible rather than being just another tool that requires yet another skill set to maneuver.
Ready to turn your idea into a powerful digital solution?
Partner with our experts to design, build, and scale technology tailored to your business goals.
Contact us Today