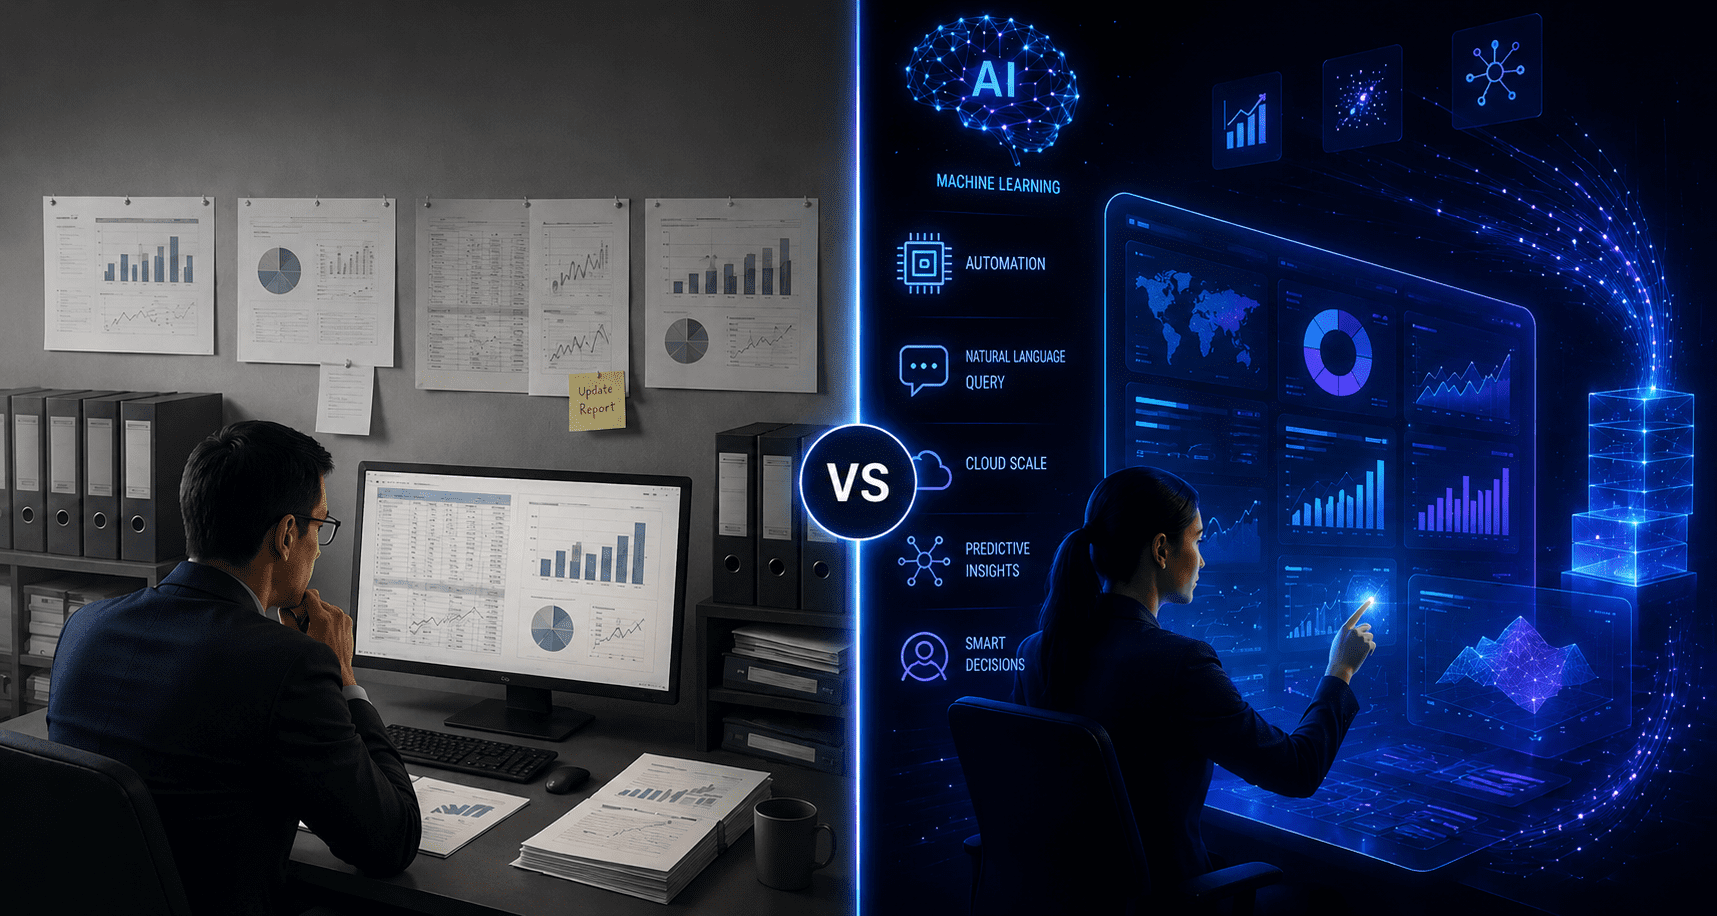
With enterprises collecting and storing more data than ever, the question of whether to use AI or traditional BI tools is hard to miss. Businesses have always used traditional business intelligence (BI) solutions to gain insights from past actions and performance with dashboards and reports. The demands of today’s businesses are for more timely, predictive, and real-time information to facilitate decision-making and enhance business agility. This transformation is driving the rise in the adoption of AI analytics in various sectors.
Precedence Research’s analysis of the global AI in data analytics market states that the market will grow from $31.22 billion in 2025 to $240.88 billion by 2033. Driven by more than just enthusiasm for the technology—it’s the expectation of how organizations will use their data and how quickly that’s driving the growth. Despite this, traditional BI continues to be useful for governance and historical analysis purposes as well as in structured reporting. The real challenge for businesses is not choosing trends over stability but deciding which is more suitable for their data maturity, business objectives, scalability requirements, and decision-making speed.
What Do Traditional BI Tools Actually Do?
To determine if to break out of traditional business intelligence, it is helpful to understand what it was designed for—and where it still stands strong. Traditional BI is simply a way of converting raw business data into structured and readable reports. It integrates data from various sources such as ERP and CRM systems, processes it through ETL pipelines, loads it into a data warehouse, and presents it in dashboards and scheduled reports.
The entire process is centered on this question: What happened? Sounds restrictive, but for a lot of business functions, this is the correct question. A board presentation should include month-end revenue numbers that are accurate, consistent, and auditable; not probabilistic forecasts. That is what Traditional BI provides. It’s the same with compliance reporting, KPI tracking, or any scenario where accuracy and visibility are more important than speed. Business tools such as Tableau and Microsoft Power BI are popular due to their ability to make complex business data easier to see and understand.
Traditional BI is stable as per its design. It works very well with historical and structured data, and users who don’t know a line of code can access its dashboards. Its weaknesses lie when the business begins asking “why,” “what next,” and “when”; it is expected to have answers before the next report cycle. This isn’t a weakness in traditional BI; it’s just a limitation of what it was supposed to do.
Where Traditional BI Starts to Break Down
Traditional BI is still very useful for structured reporting and historical analysis, but its limitations are quickly revealed in the need to make more agile and flexible decisions. The first place of conflict is speed. One business question can generate a domino effect: Analysts, SQL queries, dashboard creation, etc., and repeated rounds of validation. The question may have changed by the time the report arrives. That delay is expensive in fast-moving markets.
There is an additional layer of complexity because of the modern data. Unstructured information is found in customer conversations, customer support chats, emails, and social media and is an indicator of signals—but most traditional systems are unable to process them. Those insights just don’t fit into the picture.
Accessibility continues to be a major challenge. While many technical users have automated the generation of reports for themselves, most non-technical users remain reliant on data teams to tweak reports and provide answers to ad hoc questions, making skilled analysts into human query engines instead of strategic contributors. In large companies, dashboard overload is on top of it—hundreds of reports are added over time, few can be found easily, and many are outdated. Traditional BI isn’t broken. When the number of decisions increases faster than the number of pipelines, then it becomes limiting.
What AI Data Analytics Tools Bring to the Table?
As opposed to traditional business intelligence, AI analytics answers the questions you should have been asking. Traditional BI takes the time to wait for a human to set up the investigation. The investigation is performed by AI analytics tools, which automatically segment the data by multiple dimensions, find anomalies, test data correlations, and identify what is statistically significant—without any manual effort involved in each step.
While traditional BI systems primarily report historical performance, AI-powered ones can predict future and current performance. The biggest benefit is self-service analytics. Business users can ask questions in natural language and gain insights without needing to heavily depend on analysts and technical teams. This helps in minimizing operational bottlenecks and smoothens the decision-making process across departments.
Large chunks of the analytical process are also automated using AI tools. The system can find anomalies, correlations, segmentation of patterns, and meaningful insights without testing multiple hypotheses within minutes. Studies have revealed that AI coding and automation tools can boost productivity by more than 50% in select processes, according to studies by GitHub.
A huge advantage is the processing of structured and unstructured data, such as emails, customer conversations, reviews, and call transcripts. It lets businesses get a feel for what the customers are thinking and anticipate risks before they even materialize, to be able to respond on the spot. AI analytics doesn’t just present information; it guides organizations to ask new questions.
AI Data Analytics Tools vs Traditional BI Tools: Head-to-Head Comparison
| Comparison Factor | AI Data Analytics Tools | Traditional BI Tools | ||
|
Speed of Insight
|
Processes data in real time and delivers instant insights and alerts as changes occur. | Works in scheduled batch cycles (daily, weekly, monthly), causing delays in insights. | ||
|
Type of Questions Answered
|
Answers diagnostic and predictive questions such as why something happened and what may happen next. | Primarily answers descriptive questions like what happened, how much, and when. | ||
|
Data Types Handled
|
Handles both structured and unstructured data including emails, chat logs, transcripts, and social signals. | Mainly designed for structured data from databases, ERP systems, and spreadsheets. | ||
|
Accessibility & Self-Service
|
Uses natural language queries, allowing non-technical users to get insights independently. | Often requires analysts or technical expertise to create reports and queries. | ||
|
Depth of Investigation
|
Automatically identifies hidden patterns, anomalies, and correlations across datasets. | Limited to predefined dimensions and analyst-driven exploration. | ||
|
Governance & Auditability
|
Improving in governance but may still face challenges in explainability and compliance. | Strong governance, traceability, and auditability for finance and regulatory reporting. | ||
|
Adaptability Over Time
|
Continuously learns and adapts models based on new data and changing conditions. | Static dashboards and reports that require manual updates and reconfiguration. | ||
|
Decision-Making Capability
|
Supports proactive and predictive decision-making. | Supports reactive and historical analysis. | ||
| Business Use Case Fit
|
Best for dynamic, fast-changing environments requiring automation and forecasting. | Best for stable reporting environments with strict compliance requirements. | ||
|
User Dependency
|
Reduces reliance on data teams through AI-powered automation and self-service analytics. | Heavy dependence on analysts and BI teams for report generation and interpretation. |
1. Speed of Insight
The traditional BI works in batch cycles. Data is gathered, processed, and reported on a schedule (nightly, weekly, or monthly). The business context in which a dashboard reflects can change by the time that the dashboard is updated. AI analytics is real-time, processing data continuously and providing results on the fly as soon as something changes. An AI system can identify a sales anomaly hours before BI systems can and send an alert before the damage is done — an anomaly that could be two days late picked up by traditional BI.
2. Type of questions answered
Traditional BI is good for answering descriptive questions: what, how much, and compared to when. AI analytics takes another step on the analytics continuum: explaining what has occurred, uncovering which parameters are causing a trend, and predicting what might come next. That’s a significant difference for organisations where decisions are based more on cause than outcome.
3. Data types handled
Traditional BI is predominantly focused on structured data like rows, columns, and numeric values that come from databases, ERP, and spreadsheets. It’s not very adept at working with non-structured inputs. Can be used across both transaction data and customer emails, support chat logs, call transcripts, and social signals. This is important because an increasing percentage of business-relevant information resides outside of well-structured tables.
4. Accessibility and self-service
Both traditional BI tools and most of the data models require some level of knowledge. Most of the data models require some level of knowledge, and so do traditional BI tools in many instances; in some cases, even the query language. Business users are usually reliant on analysts to create or develop reports. This is where AI analytics comes in: A user can ask a simple question in natural language and get a direct answer without passing it on to a data team. Organizations that expand the use of data throughout business functions can make decisions five times faster than those with centralized analytics teams, according to McKinsey (2023).
5. Depth of investigation
Classical BI will only look at the dimensions that the analyst decides to look at. The tool returns a result that you define. AI systems sift through data without manual intervention, looking for patterns in all the relevant data, spotting the patterns that are statistically significant, and finding patterns that the analyst might not have considered.
6. Governance and auditability
This is where traditional BI has an edge. It produces outputs that are traceable and defensible and is backed by governed metric definitions that finance and compliance teams rely on. While AI systems have improved in this area, the structured and auditable nature of traditional BI is still a true asset, not a legacy restriction for Regulatory Reporting, Board Presentations, and Statutory Reports.
7. Adaptability over time
Traditional BI systems are very static. They show the configuration of the analysts at the time of the build and will only change when they manually update them. AI systems are adaptive and continuously learn and adapt their models based on new data, without the need for explicit reprogramming. This makes them more useful in environments where conditions change frequently.
Real-World Use Cases by Industry
1. Healthcare: Predictive Patient Care
AI analytics help hospitals and health care providers identify patients at high risk, predict how a disease will progress, and optimize treatment plans. AI models can analyze medical histories, scans, and real-time patient data in seconds, whereas traditional systems can take hours or days to analyze. AI models process medical histories, scans, and real-time patient information in seconds, compared to hours or days in traditional systems, enabling physicians to make faster and more accurate decisions.
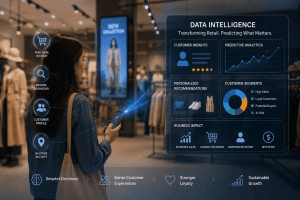
2. Retail: Personalized Customer Experiences
Retailers use AI to analyze consumer purchasing patterns, anticipate demand, and make suggestions at the point of purchase. AI-based recommendation engines are an important component of many online platforms like Amazon that leverage them to improve user experience and conversion rates.
3. Finance: Fraud Detection and Risk Analysis
AI analytics can help banks and fintech companies detect fraudulent transactions immediately by uncovering any unusual behavior. It helps to minimize fraud losses and boost the security of transactions and compliance monitoring. Juniper Research estimates that AI-powered fraud detection will drive more than $10 billion in savings for banks by 2027.
4. Manufacturing: Predictive Maintenance
AI analytics can be used by manufacturers to track machinery performance and anticipate equipment failure before it happens. This minimizes downtime, maintenance expenses, and operating efficiency.
5. Media and Entertainment: Content Personalization
AI analytics can be used by platforms like Netflix to understand viewer preferences and suggest tailored suggestions to keep them engaged and on the platform for longer.
AI Data Analytics Tools vs Traditional BI Tools: What Should USA Enterprises Choose?
Traditional BI is still the lifeline for all U.S. businesses, especially in banking, healthcare, and retail, and it does a great job of it. However, the discussion has shifted. The business questions that need to be answered are evolving, as are the business priorities. The U.S. private AI investment in 2024 was 12 times higher than China’s at $109.1 billion, according to the Stanford HAI 2025 AI Index. Including 40 AI models that deserve mention, the U.S. was the top producer of AI models last year. American companies are not trying out new ideas anymore—they are committing. And the magnitude of that commitment is evidence of a reality: the demand for insights, predictive decision-making, and operational visibility in real-time that would never have been possible without modern AI data analytics.
Yet speed without structure is its own trap. Nearly half (42%) of companies in the U.S. surveyed by S&P Global have already halted most of their AI projects, up from 17% in 2024, and half of the proofs-of-concept are not currently in production. The lesson is straightforward. Traditional BI is the governance and reliability that enterprises rely on. AI Analytics delivers the pace and depth required for today’s decisions. The successful businesses that are moving forward are not deciding between the two but are doing both, intentionally and deliberately, on a data platform that can support them.
How to Decide between AI Data Analytics Tools and Traditional BI Tools?
The right choice isn’t always one or the other. It’s about knowing where each tool earns its place.
Ask yourself three questions:
- What’s that decision you wish you could make quicker? When the answer is compliance, tracking KPIs, or reporting on history, traditional BI is enough. When it comes to forecasting churn, spotting anomalies, or comprehending unstructured data, AI analytics is more of a good fit.
- What is the complexity of your data? Traditional systems cannot keep up with high volume, multi-format, and rapid inputs. AI is designed to operate in just such an environment.
- Are your members prepared? It’s not necessarily a complete overhaul of the platform. Most businesses start with one or two high-value cases of AI, while maintaining the status quo and achieving early success with BI, and both challenges are addressed. Early value and stability in an enterprise are achieved by addressing most businesses’ initial one or two high-value AI use cases along with existing BI.
This is where Travancore Analytics’ Datalens can help. It enables enterprises to move beyond static dashboards by delivering faster insights, easier data exploration, and smarter decision support, while still working alongside existing BI systems and workflows.
Takeaway
As companies gather more real-time and unstructured data, the gap between traditional BI and AI-driven analytics is widening. Traditional BI tools still offer solid reporting, governance, and KPI tracking, while AI analytics offers faster insights, predictive intelligence, automation, and easier data exploration. More companies are discovering that rather than having to choose one or the other, they should use both in tandem—and make their analytics environment agile and scalable in the process.
Organizations with modern data foundations today will be the most successful at making better, faster decisions tomorrow. To explore this balance more effectively, discover how DataLens, the data analytics platform by Travancore Analytics, helps enterprises turn complex data into actionable business intelligence.